


Etherium (ETHUSD) Technical Analysis for the Week of 27th Jan, 2025

Cryptos are risky vehicles to trade — that is what I tell myself. But among all the cryptocurrencies, Etherium is my favorite, as it displays the most predictable technical behavior.
Let’s look at the weekly chart. Etherium price is supported by the lower parallel of the upper channel (there are two channels that I have drawn with three lines each - lower, median, and upper) consistently. Price tried to breach it through the week of 13th Jan, but it popped back up and it is retesting it currently.

To stack confluences, the weekly price sits at 50% Fib level as well.

To note, the price is also above the ichimoku Base Line which I use as sort of a filter. This gives me a slight BUY bias. I am certainly not short in these circumstances.
Now let’s drill down to the daily chart.
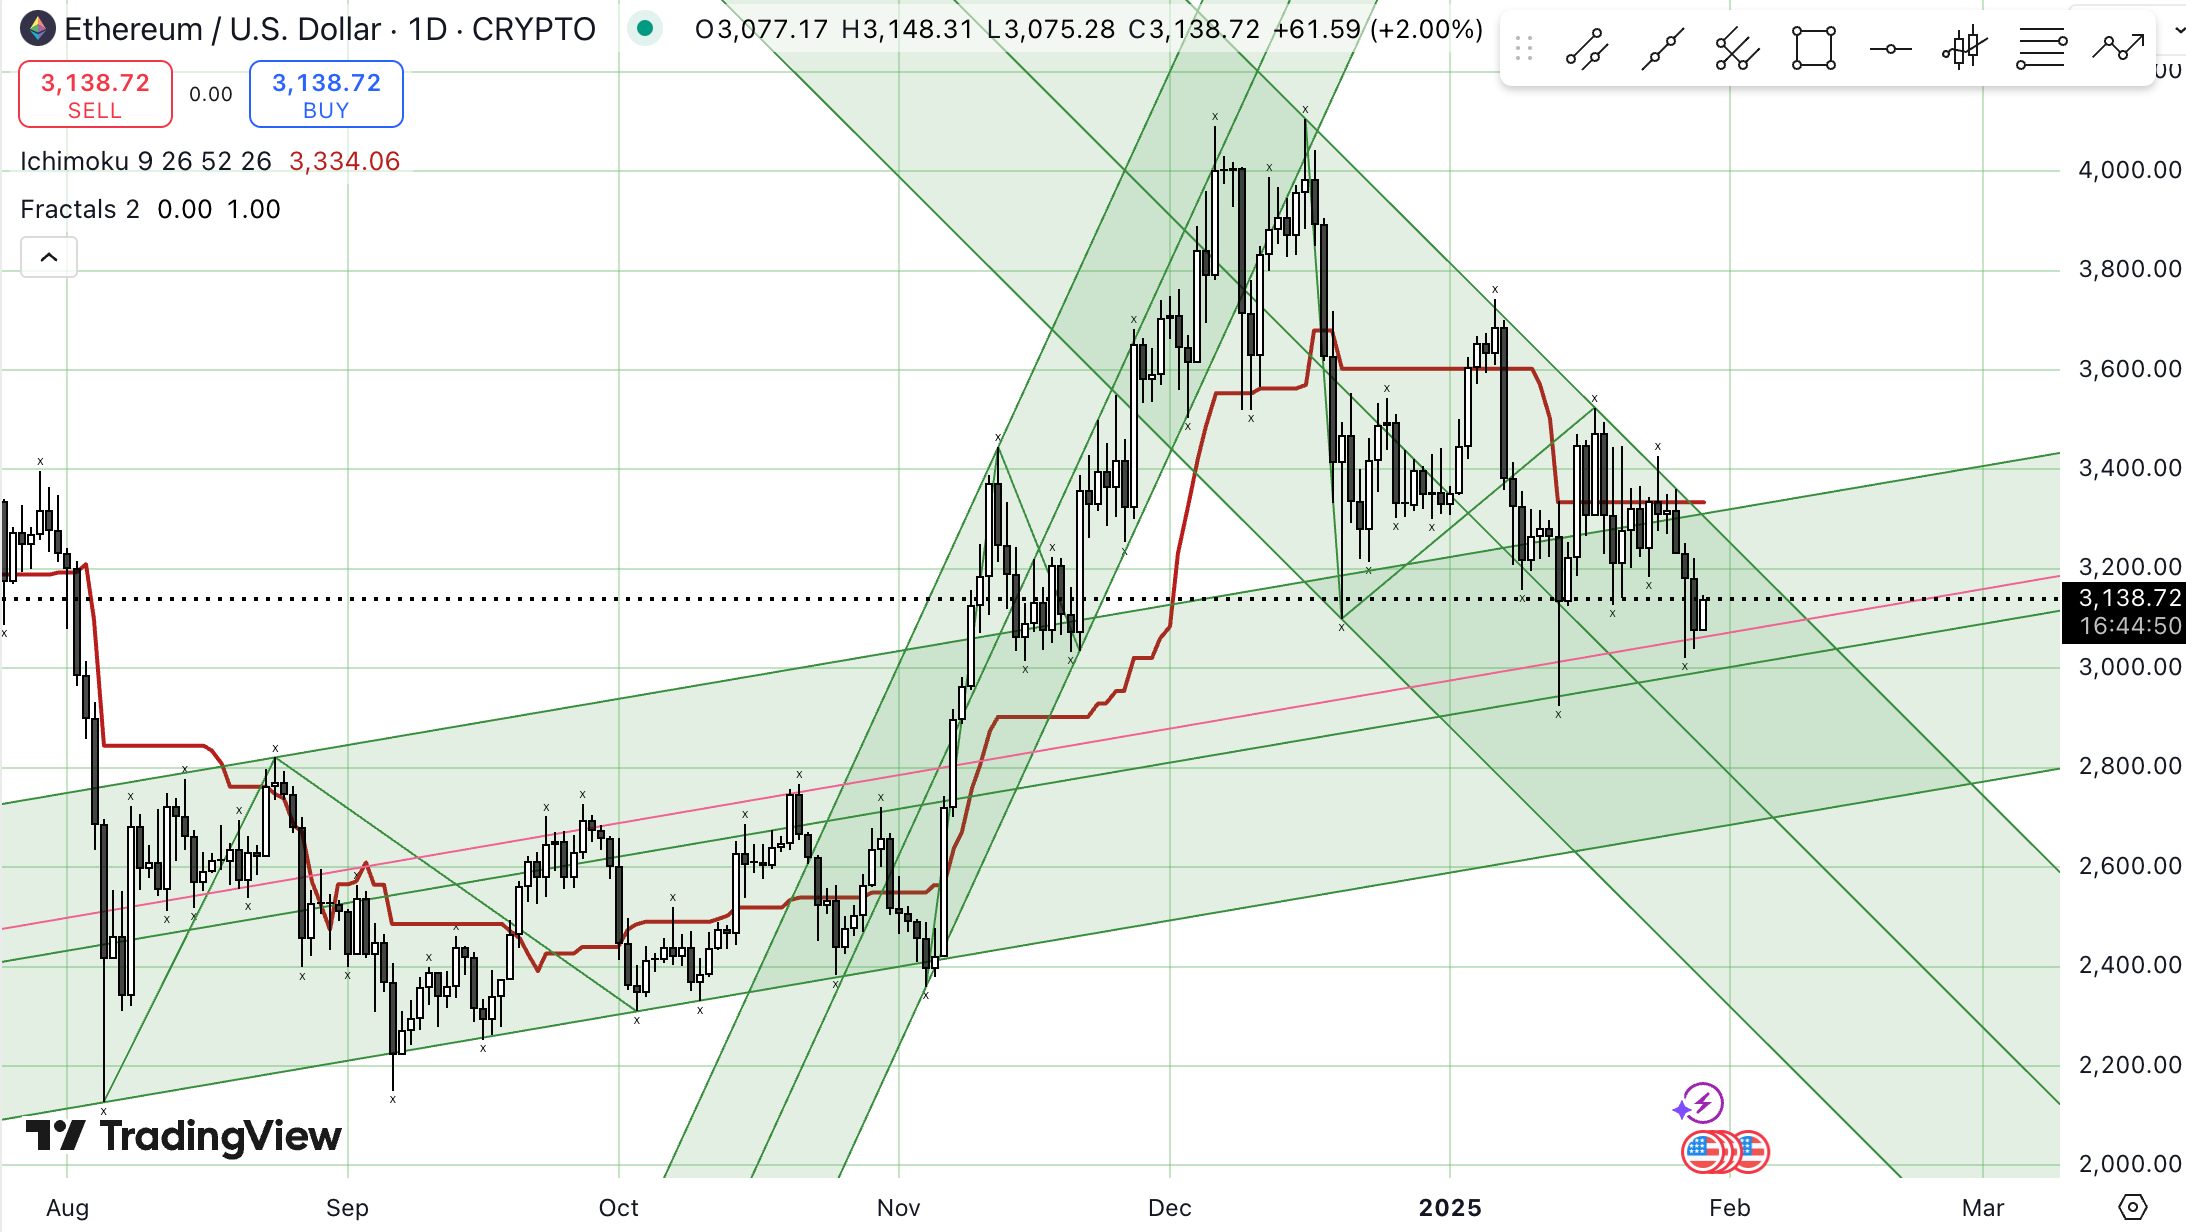
On the daily, there is a lot going on. The price in the past broke an upsloping fork and neatly formed a downsloping fork (fork is nothing but a channel) which it has followed quite well, even though the price inside it has moved quite erratically in past weeks. Also note, that price has been held twice by the sliding parallel shown in red, a previous resistance turned to support. As is evident, price is currently trapped in between the upper parallel of the dominant fork and the support from the sliding parallel of an old fork, forming a symmetrical triangle.
To make any viable trade, I would like to see this triangle resolve. The downtrend is pretty intact so far as the fork hasn’t broken.
For now, I am on the sidelines.